Retail Change and Neighborhood Activity in New York City (2019–2021): Examining Retail Vacancy, Sub-Sector Shifts, and Urban Vitality During COVID-19
This project examines how changes in retail development during the COVID-19 pandemic relate to shifts in neighborhood activity in New York City. Using subway ridership as a proxy for everyday urban presence, the study analyzes whether changes in retail vacancy and business composition are associated with changes in neighborhood-level activity between 2019 and 2021.
Where Local Loop focuses on street-level behavior and staying activity, this project operates at a broader scale. It uses aggregate data and regression analysis to identify citywide patterns in how retail environments and neighborhood activity moved together during a period of disruption.
Project Overview
How are changes in retail development—specifically vacancy and retail sub-sector composition—associated with changes in neighborhood activity during the COVID-19 pandemic in New York City?
This project treats neighborhood activity as an observable signal of urban presence rather than a complete measure of vitality.
Research Question
Retail environments are often understood as indicators of neighborhood health. Storefronts structure daily routines, shape street-level engagement, and provide reasons for people to enter and move through neighborhoods. During COVID-19, shifts toward remote work and online shopping disrupted these routines, creating an opportunity to examine how retail change and neighborhood activity moved together.
Rather than measuring individual behavior directly, this project uses transit ridership as a coarse indicator of how much everyday activity remained present in neighborhoods during this period.
Conceptual Framing: Retail and Urban Activity
Study Period
2019 (pre-COVID) and 2021 (during COVID recovery)
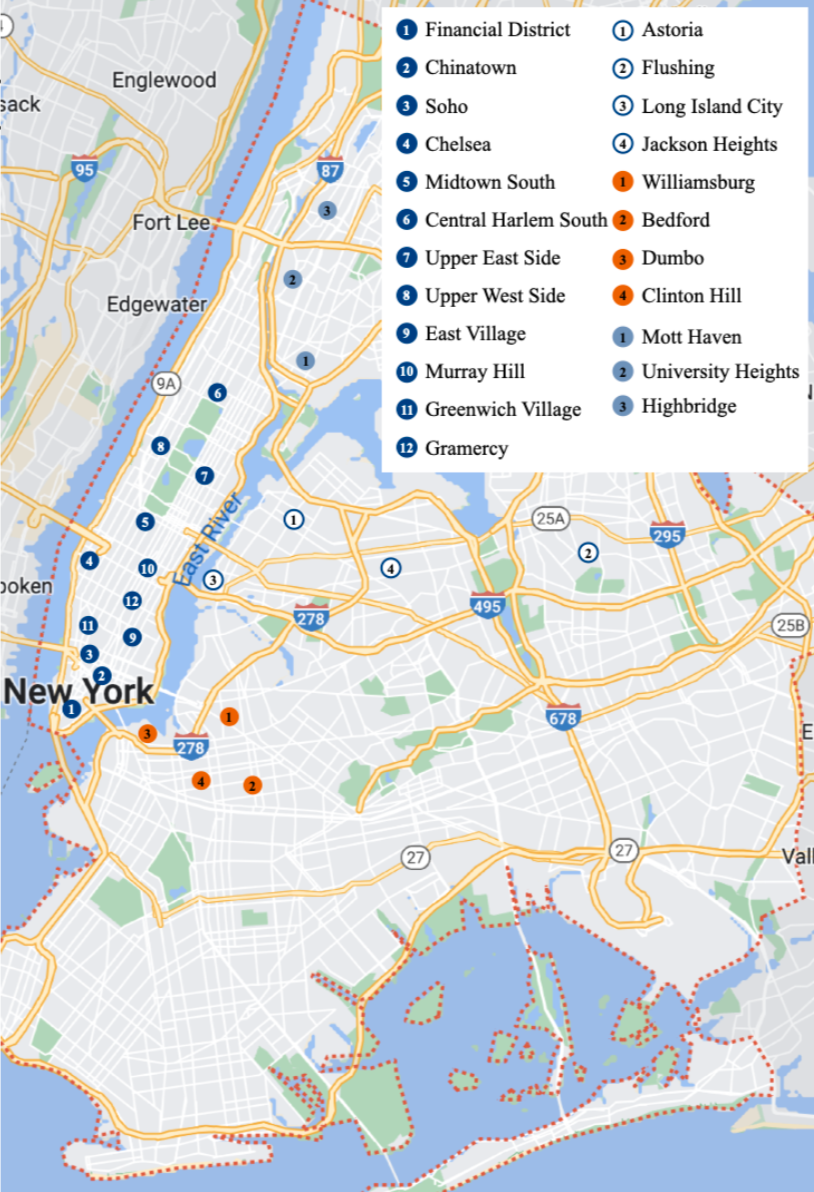
Study Area
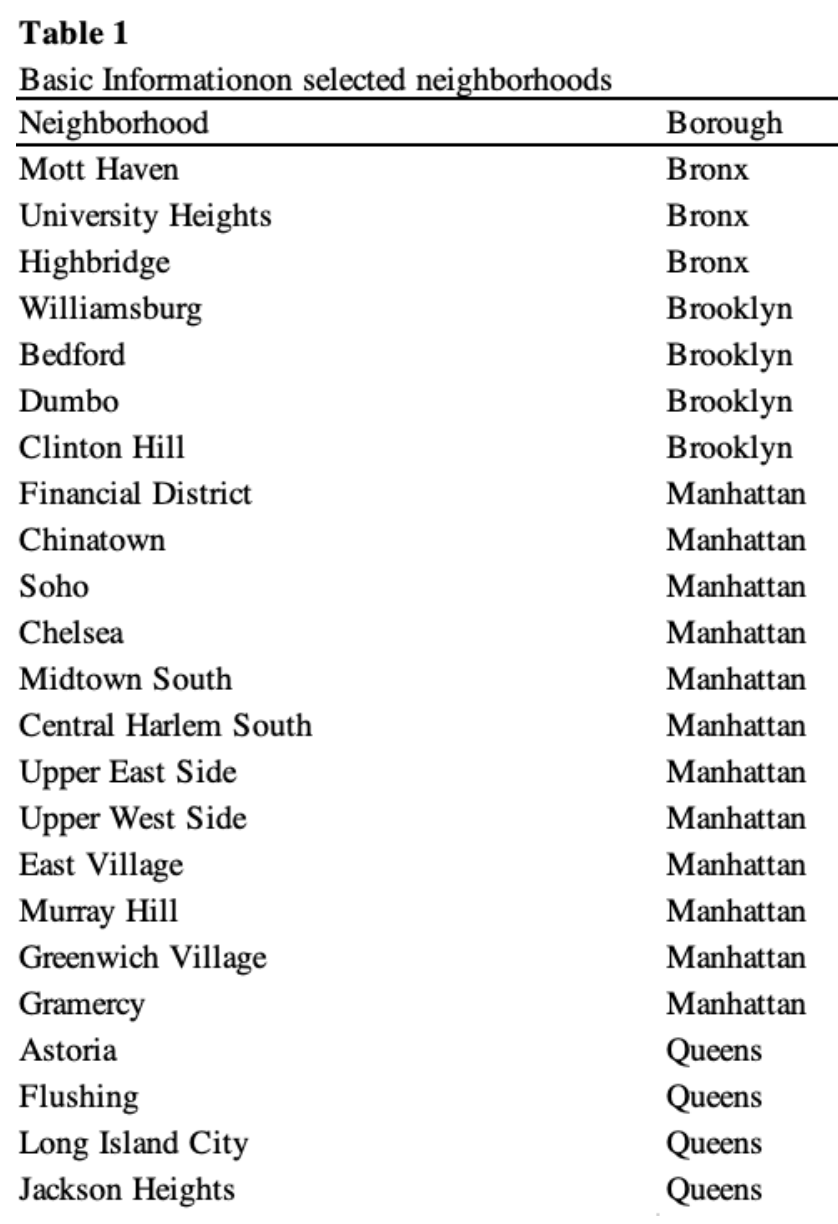
23 New York City neighborhoods with active retail corridors and subway access
Methodology
First-differenced OLS regression
Change in retail variables (2019–2021) regressed against change in log subway ridership
Model designed for comparison of coefficients, not forecasting
The first-differencing approach controls for time-invariant neighborhood characteristics and focuses on how changes over time relate to one another.
Data and Methods
Subway ridership is used as a proxy for neighborhood activity because it captures routine movement through neighborhoods as part of daily life. Entering and exiting subway stations requires walking through surrounding streets, where riders often interact with local businesses, signage, and public space.
While this measure does not capture the full social life of streets, it provides a consistent, citywide indicator of how neighborhood presence changed during the pandemic.
Measuring Neighborhood Activity
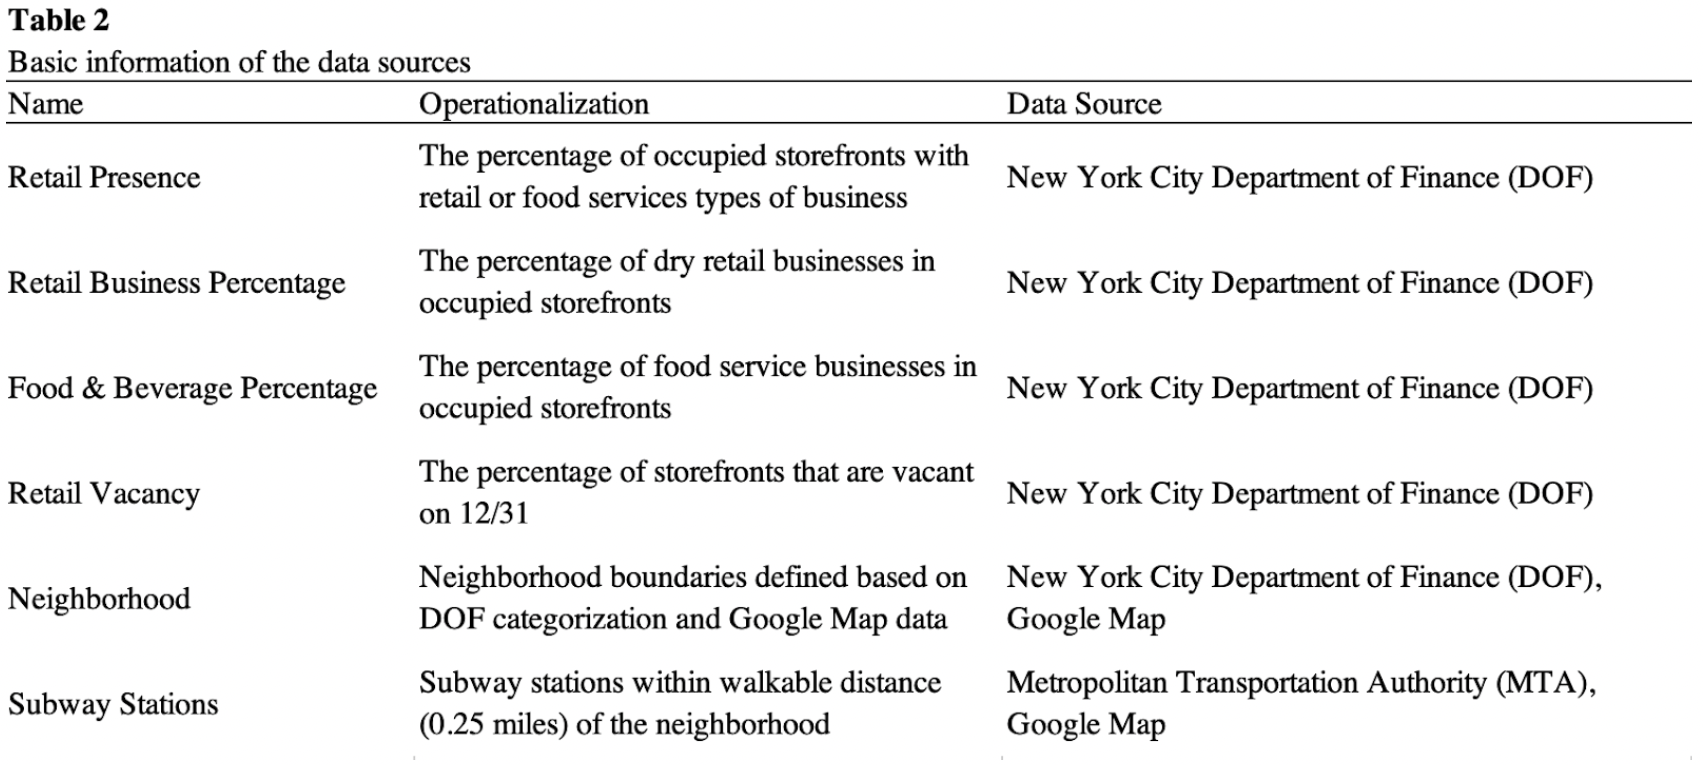
Retail development was measured using Department of Finance storefront data, which includes information on:
Retail and food & beverage presence
Retail vacancy rates
Composition of dry retail versus food & beverage businesses
These variables were selected to examine whether different types of retail change relate differently to neighborhood activity.
Retail-Related Variables
Neighborhoods were selected through a multi-step process:
Identification using the NYC Council’s Vacant Storefronts Report
Refinement using commercial market reports to focus on active retail corridors
Exclusion of areas without subway stations within a 0.25-mile walkable radius
This ensured consistency between retail data and the activity proxy.
Neighborhood Selection
Across all 23 neighborhoods, subway ridership declined between 2019 and 2021, consistent with citywide pandemic trends. Within this context, several patterns emerged:
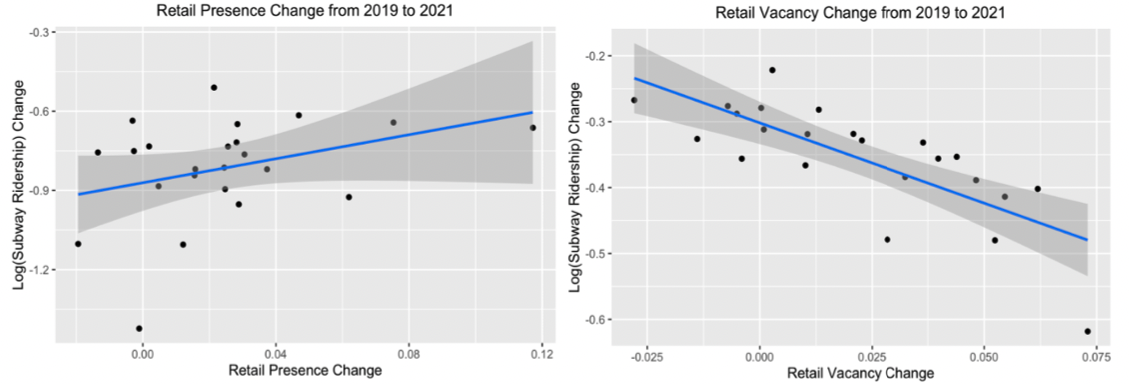
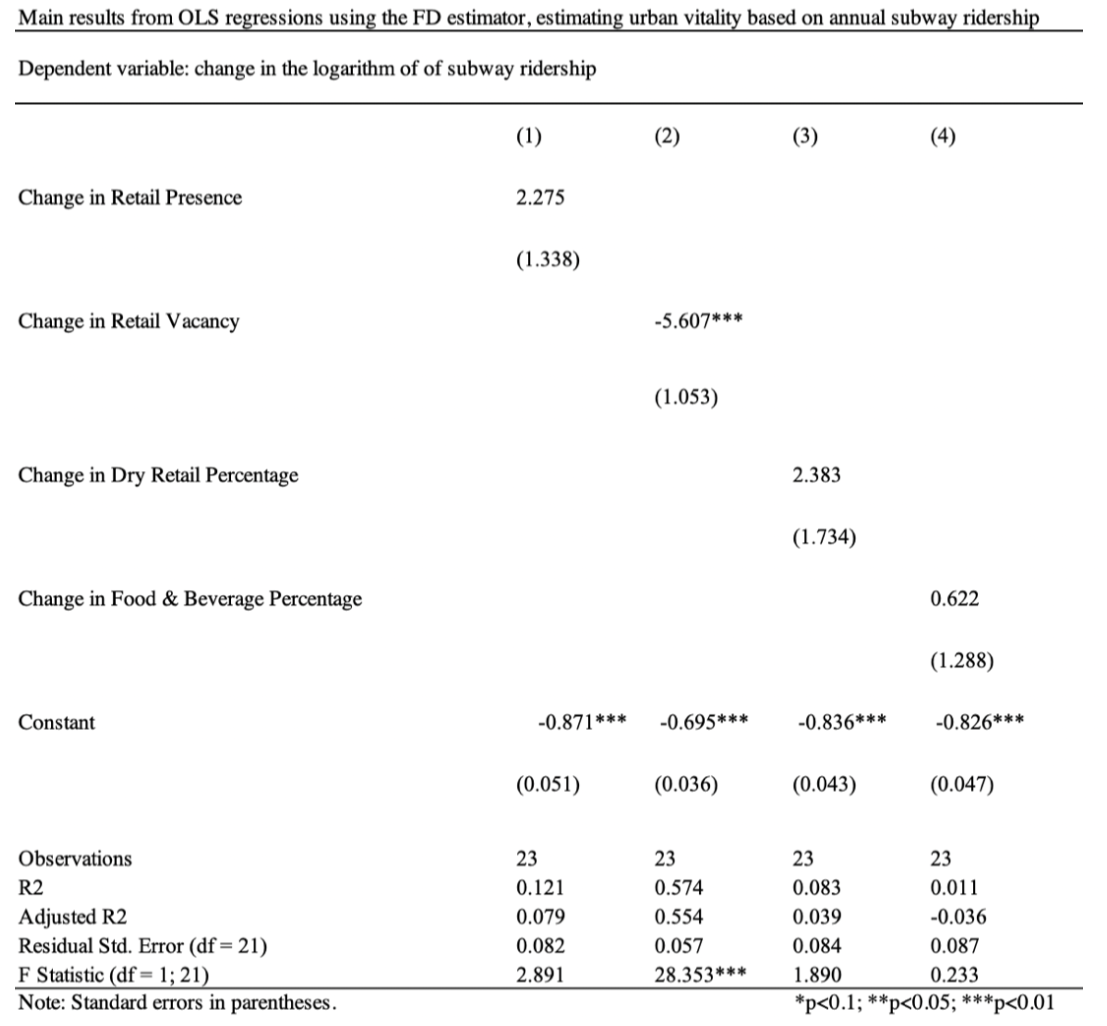
Retail vacancy showed a statistically significant negative association with subway ridership: A one-percentage-point increase in vacancy was associated with an approximate 5.6% decrease in ridership, holding other variables constant.
Retail sub-sectors displayed different relationships with activity: Changes in dry retail showed a stronger association with ridership change than food & beverage, though neither was statistically significant.
These results suggest that vacancy is a particularly sensitive indicator of neighborhood disruption, while sector composition may matter differently depending on context.
Key Findings
The stronger association between dry retail decline and neighborhood activity aligns with broader shifts during COVID-19, including increased competition from online platforms and higher operational risk for non-food retailers.
These findings do not imply causation, but they highlight how different retail forms may be differently tied to everyday neighborhood presence during periods of disruption.
Interpreting Retail Change
This project provides a macro-level view of how retail change and neighborhood activity moved together during COVID-19. While it does not measure street behavior directly, it helps contextualize patterns observed at smaller scales.
In contrast, Local Loop examines how people pause, linger, and interact with storefronts in everyday settings. Together, the two projects show how retail environments relate to urban life both statistically and behaviorally—one identifying patterns, the other investigating mechanisms.
Relationship to Street-Level Behavior
Subway ridership is a partial proxy and does not capture all forms of urban activity
Sample size is limited (N = 23), constraining statistical power
Results describe associations, not causal relationships
These limitations are acknowledged and inform cautious interpretation of the findings.
Limitations
Retail vacancy is closely associated with declines in neighborhood activity during disruption
Retail sub-sectors may relate differently to urban presence
Aggregate indicators can reveal broad patterns that complement street-level observation
Takeaways
The primary objective of this research project is to investigate how changes in retail developments, including its presence, vacancy, and business compositions, shapes New York City. By regressing the change in retail development between 2021 and 2019 with the logarithm change in subway ridership, the coefficient should reveal if the association between the independent variable and dependent variable is positive or negative. Data for 2019 and 2021 are collected from various data sources and will be used to calculate the difference between the time period for all independent variables and the dependent variable. Through regression analysis, this study aims to investigate the distinct effects of four independent variables on subway ridership in relation to neighborhood vitality during the period of the COVID-19 pandemic's impact on the retail environment of New York City. The utilization of a first-differenced regression model in this research is not aimed at forecasting future changes in subway ridership but rather to facilitate the comparison of coefficients of interest.
Metrics for evaluating retail development in relation to neighborhood vitality change
Subway ridership is chosen as a proxy variable for neighborhood vitality. Existing research that evaluates the livelihood of the urban environment uses comprehensive traffic data including road, public transportation, and walkability. In this research, subway ridership is the sole data source being analyzed due to the prevalence of the subway system and how convenient the subway ridership data collection and analysis are. As the main public transportation, the New York City subway operates in Manhattan, Queens, Brooklyn, and the Bronx on a 24-hour basis. In 2021, the New York City subway had a daily ridership of approximately 2.4 million, two times the bus system (MTA 2023).
As a proxy variable for measuring human activities which represents neighborhood vitality, subway ridership reveals a part of the riders’ routine. Whether it is entering the station for heading to another destination or returning home, the process in which the rider walks in the neighborhood before entering the selected subway stations indicates their activities in the specific neighborhood where their activities are very likely to generate other forms of vitality. When riders spend their money in the neighborhood bodega or cafe, they create monetary revenue for the neighborhood businesses; at times they stop for posters or notice the city light pole banner campaign, they might be intrigued by the culture of the neighborhood and decide to frequent the area often.
In this research, the choice of subway ridership is backed by past research that has demonstrated the effectiveness of using traffic data as a reliable source for understanding the city. Additionally, it is supported by the street life and walkability defended by Jane Jacobs (1992) and other scholars (Deehr and Shumann 2009; Frank et al. 2010). Therefore, this research highlights the idea of walkable distance in the analysis, specifically when locating subway stations in the neighborhood. Subway stations within the neighborhood border and 0.25 miles (Sohn, Moudon, and Lee 2012) of walking distance within the border are collected for the analysis.
Retail Development-Related Independent Variables: The investigation of how retailing affects the vibrancy of neighborhoods encompasses an examination of several factors, including the presence of retail and food & beverage establishments, the extent of retail vacancy, and the disparity between the dry retail and food & beverage offerings by regressing retail and food service businesses separately. All of the above variables are included in the regression using data obtained from the DOF’s data on storefront vacancy which includes information on the number of vacant units and types of business in the neighborhood. The dataset was created to comply with Local Law 157 of 2019 which requires owners to provide information about ground and second-floor storefronts on their properties.
Selecting neighborhoods: The neighborhoods were first identified using the New York City Council’s Vacant Storefronts report (2020), which compiles ground-floor retail data from the Department of Finance (DOF). To refine this list, I incorporated MNS Real Estate’s commercial market reports to prioritize neighborhoods with active retail corridors. Finally, Google Maps georeferencing was used to exclude areas without subway stations within a walkable radius, ensuring consistency with the study’s vitality proxy, subway ridership.
The analysis shows that retail development is meaningfully correlated with urban vitality. Retail vacancy during COVID-19 is strongly associated with reduced subway ridership, the study’s proxy for neighborhood activity. Other retail-related variables display positive correlations with vitality, though these relationships are not statistically significant, in part due to the limited sample size (N = 23). The results also reveal sub-sector differences: changes in dry retail show a stronger association with vitality than changes in food and beverage establishments.
Retail vacancy is a strong negative predictor of urban vitality. The model examining retail vacancy indicates a statistically significant negative relationship between the change in vacancy rates (2019–2021) and the change in log subway ridership over the same period. The coefficient for vacancy change is –5.607 (p < 0.01), meaning that: For every one-percentage-point increase in retail vacancy, subway ridership decreases by approximately 5.6%, holding other factors constant.
This result supports the initial hypothesis that increasing storefront vacancy corresponds with declining neighborhood activity during COVID-19. It also underscores the usefulness of vacancy as a measurable indicator of shifts in urban vitality.
Dry retail shifts exhibit a stronger association with vitality than food & beverage shifts. Sub-sector models compare how changes in dry retail and food & beverage shares relate to changes in subway ridership. Although neither coefficient is statistically significant (p > 0.1), their magnitudes differ: 2.383 for dry retail and 0.622 for food & beverage.
Subway ridership declined in all 23 neighborhoods between 2019 and 2021 (by 22%–61%), consistent with the Office of the New York State Comptroller’s report on the pandemic’s severe impact on transit usage. Within this context, the positive coefficients indicate that increases in either sector’s share are associated with more pronounced ridership declines, with dry retail showing the stronger association. While not statistically conclusive, this pattern is consistent with the continued contraction of the dry retail sector during the pandemic.

Retail performance as indicators of urban vitality
Fostering a sense of place by preserving local businesses
Retailing is an important indicator of a city's health and is often leveraged as an urban revitalization strategy. It is a crucial component of the urban experience for both locals and visitors. Storefront businesses, in particular, play a vital role in preserving the unique urban character of downtown areas. They provide spaces for urban social life and culture, sustaining the vitality of neighborhoods and cities. A dynamic business environment at the street level enhances neighborhood safety and facilitates the negotiation of subcultures, preserving the culture of restaurants and theaters and attracting people to live and work in the city. This, in turn, provides human capital for innovation, which is essential for growth and city health. To maintain urban vitality and promote equitable development, it is crucial to preserve small and local street-level businesses in the downtown retail mix.
To promote urban vitality through retail development, cities can play a critical role in supporting small and local businesses. Financial assistance, such as grants, loans, and tax incentives, can help decrease operating costs and improve cash flow. Streamlining regulatory processes, like digitizing storefront registries, can make it easier for businesses to obtain permits and licenses, improve operational efficiency, and provide more transparency for local business owners. Additionally, fostering partnerships with local community organizations and nonprofits can provide valuable support to small and local businesses. In the long term, creating walkable and bike-friendly neighborhoods can encourage people to visit and patronize small businesses. These strategies can support the growth and success of small and local businesses, which are essential to the economic vitality and character of a city. By implementing these policies, cities can help small businesses thrive and contribute to the vibrancy and diversity of their communities.