Modeling Retail Vacancy and Subway Ridership in NYC
This project builds a station-level simulation model linking retail vacancy patterns to annual subway ridership in New York City. Using geospatial joins, historical storefront records, and machine-learning inference, it explores how changes in neighborhood retail conditions may influence transit demand.
How does retail vacancy near subway stations relate to transit usage and what happens if vacancies change?
Interactive Demo: explore how retail vacancy near subway stations relates to annual ridership in NYC (2023 baseline)
Hover over stations to see
Station name
Annual ridership
Nearby retail vacancies (1.5-mile walking catchment)
Each dot represents a subway station complex; data reflects pre-policy baseline conditions
Methodology
Data
NYC storefront registry (vacancy status by business type)
MTA annual station ridership (2019–2024)
Subway station geographies (complex-level)
Model
Spatial aggregation within 1.5-mile walking buffers
Random Forest regression
Target: log annual ridership
Features: retail vacancy counts, total storefronts
Interpretation tools
Feature importance
Partial dependence plots
Scenario simulation (counterfactual vacancy change)
Why Retail: findings from the model
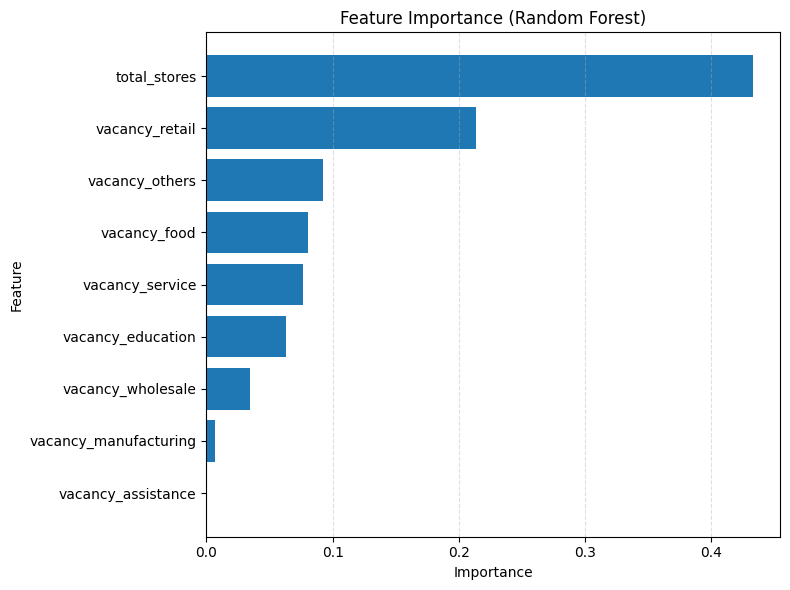
Importance Chart
Total storefront density dominates: station areas with more active storefront systematically attract more riders
Retail vacancy is the #1 vacancy signal, as the most influential modifiable factor
Among vacancy measures, retail vacancy is followed by food and service-related vacancies
Institutional and non–pedestrian-facing uses such as manufacturing and wholesale show minimal association with ridership outcomes
Scenario Testing: how the model responds to change in retail vacancy?
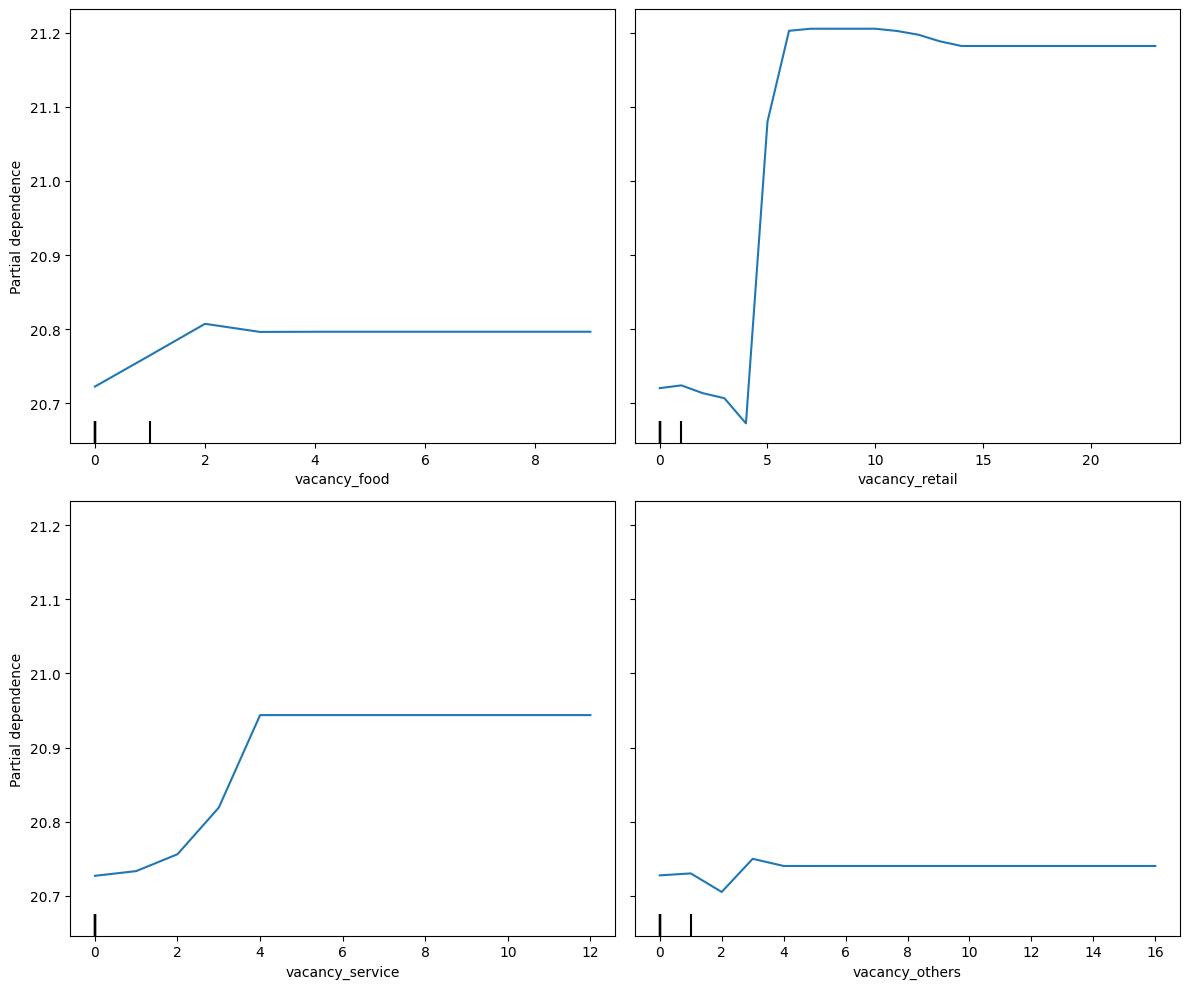
Partial Dependency Plot
The model suggests diminishing returns beyond moderate vacancy levels
Retail vacancy has a nonlinear threshold effect: once vacancy reaches a critical mass, ridership drops sharply
A small amount of food vacancy is associated with lower ridership, but additional food vacancies beyond a low threshold do not worsen outcomes further
System Design Insight
Retail continuity matters more than retail quantity: even a small cluster of retail vacancies triggers a noticeable drop in predicted ridership
Prevent the first few vacancies: early deterioration has outsized impact. Interventions should focus on stopping the first vacancy before a cluster forms
Even partial retail activation can prevent large losses:
incremental activation (pop-ups, short-term leases, kiosks) is effective
“Everyday-use” destinations act as “stabilizers” in weak retail areas: food and services can help stablize station areas and fill micro-gaps and soften vacancy shocks
Total storefront density is the underlying structural driver: strengthening retail ecosystems at the block level may matter more than any single store.
Address the early warning signs of commercial corridor disinvestment: high vacancy rates in Unknown categories usually indicate older storefronts and long-term vacancy
Limitations
Vacancy data has low temporal resolution: end-of-year reporting misses in-year openings and closures, limiting the model’s ability to capture dynamic storefront turnover
Vacancy features have low variance relative to ridership: vacancy counts are small (1–10 units) compared to large ridership ranges, causing Random Forest to prioritize higher-variance predictors
“Unknown” business activity dominates vacancy: a large share of vacancies fall into the “Unknown” category (often long-term vacancies), limiting meaningful segmentation by retail type
Fixed-radius buffers oversimplify station catchments: the 1.5-mile circular buffer does not reflect real pedestrian networks, potentially overstating or understating each station’s retail exposure
Scenario simulations rely on ceteris paribus assumptions: vacancy-change scenarios hold store density, baseline ridership, and competing stations constant, capturing marginal effects rather than full system dynamics